From Field to Framework
Integrating Agriculture into Climate Damage Assessment

I have been invited to give a talk at a Forestry and Agriculture Modeling Forum. My presentation will draw on a paper I coauthored (Fei et al. 2023) and my ongoing interest in reduced-complexity impact models.1 This post is an opportunity for me to share some of those thoughts with a non-specialist audience. I will start with a primer on how climate affects agriculture, then walk through what we found in Fei et al., and end with what I think are the challenges involved in building a good simplified model of climate impacts on farming.
How Climate Affects Agriculture
Climate change starts with warming. And warming has some obvious effects on agriculture: longer growing seasons, northward movement of plant hardiness zones (see this Climate Central piece), lower milk production from heat-stressed dairy cows.
But what about the net effect on the industry as a whole - averaging across winners and losers? As the best weather for corn migrates from Iowa and Illinois northward to Minnesota and Wisconsin, will differences in soil quality and solar insolation lead to impacts despite the similar weather? And how will the frequency of heat waves (which can damage crops) change relative to average summer temperatures? The answers to these questions continue to be uncertain.
Warming also means less cold, which is, for the most part, good for plants — with important exceptions. Freezing temperatures help kill many pests and pathogens. Some plants need cold soil to germinate properly. Snow stores water through the winter for summer use. And there is some evidence that climate change increases the frequency of “false springs,” the cruel meteorological trick of convincing plants to emerge early only to kill them with a late frost (evidence here). My former EPA colleagues modeled how these trends might evolve, and the answer turns out to be complicated. (It’s always complicated.)
Climate change also alters rainfall — expected to fall less often but in larger quantities. This means both more flooding and more drought. Droughts can, in principle, be addressed by irrigation as long as we don’t exhaust our aquifers in the process. Flooded fields are harder to work around.
The CO₂ fertilization question
A key topic when discussing climate and agriculture is carbon fertilization. Plants use the energy from sunlight2 to pull carbon dioxide out of the atmosphere in order to grow. A higher atmospheric CO₂ concentration means less energy expenditure per unit of carbon captured.
Carbon fertilization is, on net, mostly a good thing for plant growth. But it has three important drawbacks:
C4 crops don’t benefit the same way. Corn and sorghum use a photosynthetic pathway (C4) that already concentrates CO₂ near the site of carbon fixation. They get less yield benefit from elevated atmospheric CO₂ than C3 crops like wheat, soybeans, and rice.3
Weeds benefit too - maybe more. Invasive plants and agricultural weeds tend to respond strongly to elevated CO₂, which creates competitive pressure on crops and pushes farmers toward more herbicide use.4
Nutritional quality declines. Plants adapt to the more accessible carbon by investing less in nitrogen-based compounds. Since protein is built on nitrogen, elevated CO₂ reduces the protein-per-pound content of many crops. The same applies to iron, zinc, and other micronutrients - a real public health concern in food-insecure parts of the world, and for unmanaged ecosystems, but not nothing even in the US where fertilizer use can compensate for this effect (see Beach et al. 2019, on which I am a co-author).
The market piece can have counterintuitive effects
Any serious analysis has to account for how yield changes interact with local and global markets. It turns out that reductions in crop yield are sometimes actually good for farmers: prices rise faster than yields fall, increasing farm income. But this is, of course, bad for consumers. And because the US is a net exporter of food, lower global yields can benefit US GDP even while hurting the average American grocery shopper (and people around the world) (as discussed in a great article by Wolfram Schlenker).
An analogy from recent events: the US is a net exporter of oil. When global energy supply tightens and oil prices spike, US GDP benefits and fossil fuel companies profit but the average American household pays more at the pump. The same logic applies to food.
What Fei et al. Found
The paper I coauthored in Anthropocene in 2023 (Fei et al.) provides estimates of climate change impacts on US agricultural yields and the agricultural economy through the end of the century. We used two approaches to model crop yields - a process-based model (LPJmL) and a family of econometric models - and fed those yield estimates into an integrated agricultural sector model (FASOM) to assess economic impacts. Note that the mean response from the Global Gridden Crop Model Intercomparison Project (GGCMI) was worse than either the LPJmL or econometric results from Fei et al, so take these results as a best case scenario.
The headline results, using the process-based model under a high-emissions scenario:
Wheat, soybeans, and grassland show yield gains by end-of-century, driven largely by CO₂ fertilization
Corn and sorghum show more muted responses - smaller gains or slight losses - consistent with their lesser CO₂ sensitivity as C4 crops
Regionally, yields in the South tend to decline (heat stress dominates), while the North and Northwest tend to show gains (see Figure 1)
On the economics: domestic producers gain roughly $16B/year, international actors gain $6B/year5, but domestic consumers lose $11B/year, for a net welfare gain of about $12B/year — relative to a no-climate-change baseline. This can be compared to net farm income of about $100B/year.
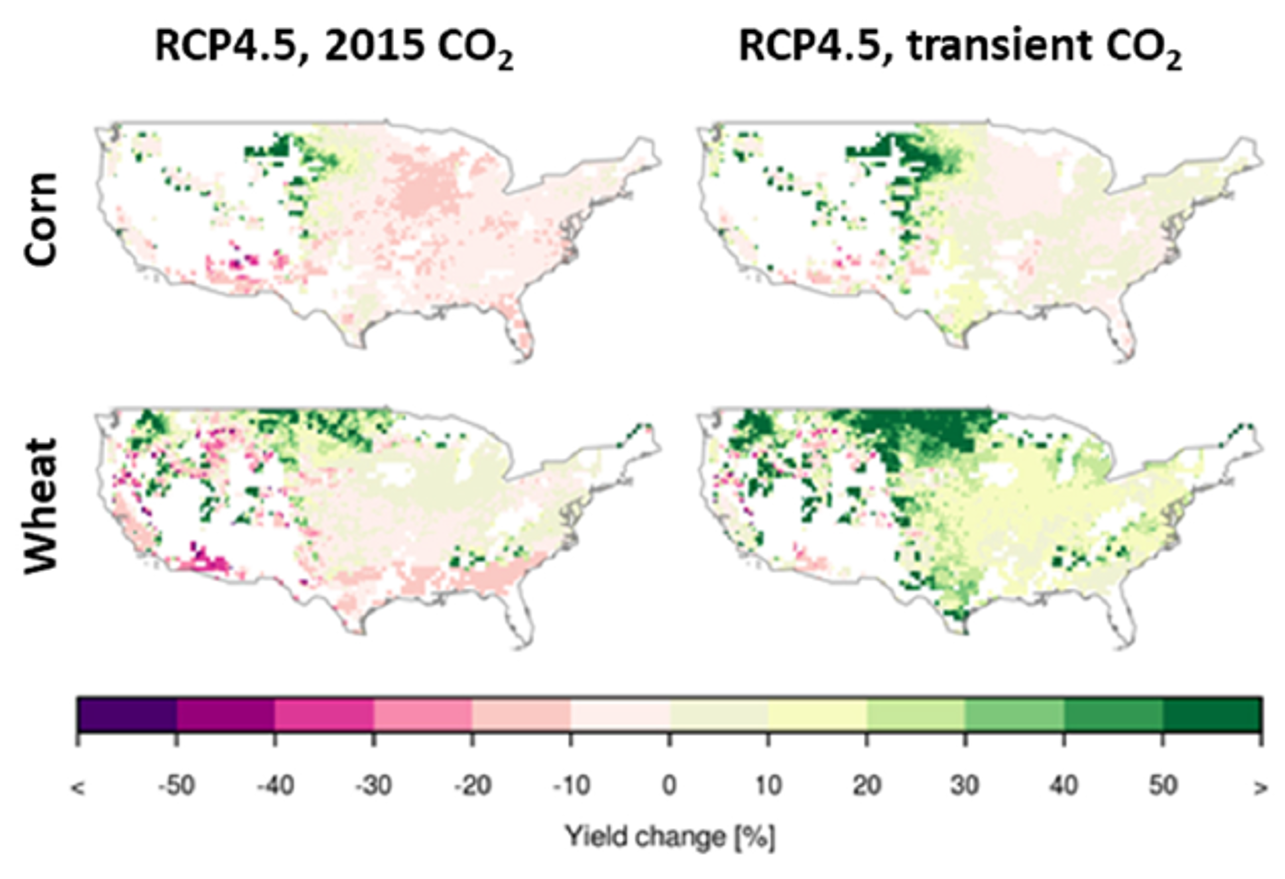
Figure 1: Projected end-of-century yield changes from LPJmL driven by CMIP5-LOCA RCP4.5 with constant CO2 and transient CO2 concentrations for wheat and corn (RCP8.5 and other crops available in the original Fei et al. figure). Econometric results not shown, but would be more negative (red), and GGCMI results would be more negative still.
However when we used the econometric model instead of the process-based model, the results flipped from a net welfare gain of ~$12B to a net welfare loss of more than $28B. This swing in estimated impacts reflects deep uncertainty in the effects of climate and CO2 on agriculture. Many scientists I have talked to also theorize that most ag models not only underestimate the most likely impacts of climate on agriculture, but are also missing a substantial negative tail on the uncertainty of those impacts.
Our sensitivity analyses also quantified how much various difficult to model factors would influence the results (see Figure 2). Flooding stands out: in our framework, a 1993-scale Midwestern flood caused $41 billion in damages, so increasing the frequency of that flood from 1 in 100 years to 1 in 10 would move from 0.4 billion/year to 4 billion/year in damages. International trade dynamics, when included, reduced welfare by an additional $14–24B depending on warming level. Inclusion of these effects could be important.
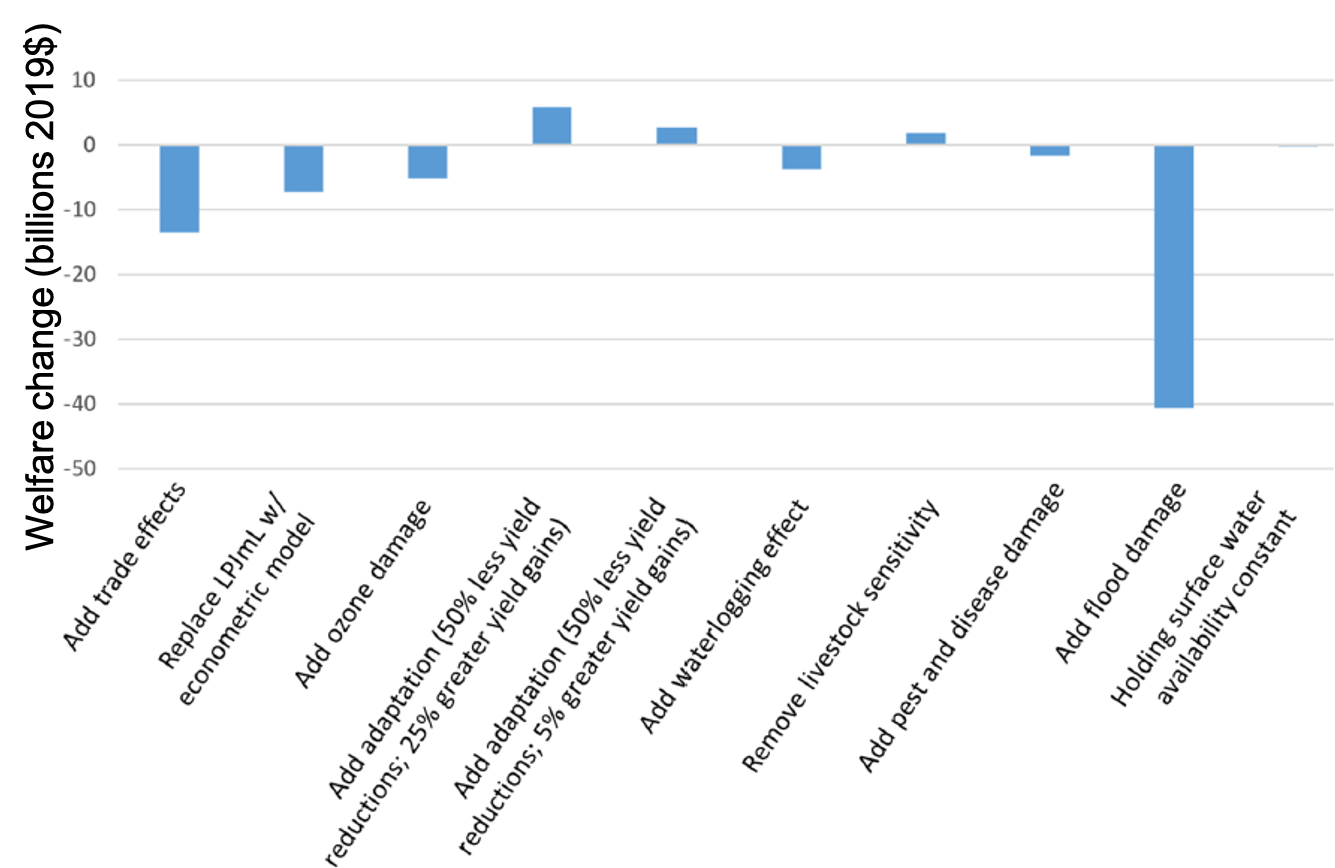
Figure 2: Changes in economic welfare associated with each of the sensitivity analyses from Fei et al. Note that the flood damage bar is showing the impact of a 1993-type flood event: if the event is occurring less than annually, the bar would be correspondingly smaller.
Reduced-Complexity Models: A Brief Primer
There are about 30 state-of-the-art global climate models (GCMs) in active use around the world.6 Each one contains a miniature emulation of the Earth (land, oceans, atmosphere, sea ice, etc.) producing modeled temperature, rainfall, winds, and cloudiness from the pre-industrial era to 2100. They are genuinely remarkable pieces of scientific engineering.
They also have limitations. GCMs divide the world into grid boxes of roughly 50–100 km on a side, which is coarse enough that important processes (convection, cloud formation, some precipitation dynamics) have to be parameterized rather than explicitly simulated (in contrast, weather models have resolutions of 3-12 km). These parameterizations are estimated from historical data, which means they may not hold up in the kinds of climate states we’re heading toward. GCMs also take hundreds of hours of supercomputer time to run a single century-long simulation, which constrains how many scenarios can be explored.
Two additional limitations are less widely appreciated.7 First, GCMs are chaotic: small differences in initial conditions grow over time, making it hard to isolate the effect of a specific forcing (say, one extra gigaton of CO₂ emissions). Second, GCMs are not probability distributions - each model represents one research team’s best estimate of how the Earth works, and treating 30 such models as 30 equally probable draws from a well-characterized uncertainty space is not quite right.
Reduced-complexity models (like FaIR, the model I use in my other work) address some of these limitations. They run in milliseconds, are designed for probabilistic use, and don’t exhibit chaotic behavior. The tradeoff is that they only directly produce global average annual temperature. Getting from global temperature to local daily climate, and from local climate to economic damages, requires additional steps.
Two main approaches exist. The first is pattern scaling: combine the reduced-complexity temperature model with a tool that translates global temperature change into regional climate variables (temperature, precipitation, and so on) which are then fed into a full damage model. The advantage of this approach is that the full complexity of the damage model is preserved. The disadvantages are computational time at the back end, along with potential introduction of errors resulting from pattern scaling.
The second is the by-degree (or warming-level) approach: pre-compute damage estimates by running a full damage model at multiple levels of global warming, embed the results in a damage function indexed to global temperature, and then apply that function directly to reduced-complexity temperature output. This is how FrEDI (EPA’s reduced-form damage model, which I helped develop) works.
The by-degree approach is powerful precisely because it can be coupled with probabilistic reduced-complexity models to explore thousands of possible future trajectories at negligible computational cost. But it requires that the damage function be properly specified. For most sectors, a function of global temperature alone works reasonably well because most other climate impacts generally scale with temperature. Agriculture is a case where using temperature alone introduces a flaw: the CO₂ fertilization effect means that a temperature-only damage function will be misspecified. One solution is a two-dimensional response surface - damages as a function of both temperature and CO₂ concentration - but building and validating such a surface is considerably more work than the standard one-dimensional case.
Pattern scaling can sidestep the temperature/CO₂ connection by preserving both as explicit inputs, but at the cost of computational complexity. This tension is one of the key factors that make agricultural damage modeling particularly difficult.
Why Agriculture Is Particularly Hard to Simplify
This is where I have the most to contribute for an audience at a forestry and agriculture modeling forum, given that I am not primarily a forestry or ag modeler. Building a good reduced-form damage function for agriculture is harder than for most other sectors. Here are six main reasons:
1. CO₂ fertilization and temperature are two distinct forcing dimensions
A good agricultural damage function should depend on temperature and CO₂ concentration separately. While these are correlated under any given emissions scenario, these two drivers have some independence in their variation: for example, climate sensitivity is an uncertain parameter that changes how much the earth system responds to an increase in CO₂. Many reduced-form models treat agriculture as purely temperature-driven with the CO₂ increase implied within the damage function.
2. Agriculture is deeply embedded in global trade, which is hard to reduce
Domestic crop production doesn’t exist in isolation. US wheat prices depend on harvests in Ukraine. US corn exports depend on demand from dozens of countries. FASOM includes bilateral trade with 22 international regions, and in our sensitivity analysis, adding global trade dynamics shifted welfare by $14–24B. No simple damage function I’m aware of captures this adequately. It’s not that it’s impossible in principle; it’s that the coupling is nonlinear and scenario-dependent in ways that resist clean parameterization.
There’s an additional wrinkle: agricultural markets are sensitive not just to climate, but to climate policy. Mandates like the Renewable Fuel Standard create politically-driven demand shocks for corn and soybeans that have nothing to do with yield changes.
3. Agriculture is a small share of GDP but the potential impacts are large
US agriculture and food-related industries account for roughly 5.5% of GDP and 11% of employment. That sounds small enough that an IAM [integrated assessment model] might treat it as a second-order concern. But food demand is somewhat inelastic (everyone needs to eat), so reductions in production can lead to large increases in price (just like with oil). Reduced-form damage estimates that are based on estimating the effects of marginal changes may systematically understate the total economic impact if agriculture is hit hard.
4. Technological change matters, and it evolves over time
Our analysis held technology constant (at 2020 levels) throughout future projections in order to isolate the climate change signal. That’s methodologically defensible but obviously artificial: over 80 years, crop varieties will change, irrigation technology will improve, farming practices will adapt. Our approach does address crop switching,8 but not more fundamental developments. Technological adaptation is hard to predict. And adaptation that relies on aquifers means that models should also address the potential for aquifer depletion. But to address these issues means that in addition to estimating a damage function where each degree of temperature is paired with several different CO2 concentrations, each of those calculations would need to be paired with multiple future adaptation assumptions in order to build up a full response surface.
5. Climate change → more pests and weeds → more pesticides → downstream water quality impacts
My former collaborator Lew Ziska pointed out something that I think deserves more systematic attention: we grow many crops across the full range of US latitudes, but a key difference between north and south is how much herbicide and pesticide farmers need to use. Warmer conditions expand the range of many pests and accelerate weed growth. Increased herbicide and pesticide use will mean a real economic cost to farmers. Perhaps more importantly, increased pesticide and herbicide application has downstream consequences for water quality, aquatic ecosystems, and human health. To the best of my knowledge, this particular impact is almost entirely absent from current agricultural damage frameworks.
6. GCMs tend to “drizzle,” missing the worst flooding and drought events
GCMs are known to produce precipitation that is too frequent and too light relative to observations, a bias sometimes called the “drizzle problem.” This means that when we use GCM output to drive agricultural damage models, we may be systematically underestimating damage from the extreme precipitation events that actually matter most for crop losses. Downscaling approaches improve precipitation statistics but remain limited and their performance on extremes is not as good as would be ideal (see Hartke et al. 2025). In Fei et al., we estimated flood damage using the 1993 Midwestern flood as a scaling event, assuming that in any given year there was a 1-in-100 chance of a flood of that magnitude. The welfare loss from a single such event was $41B; if its recurrence frequency increases to once per decade, the annualized damage rises from $0.4B to $4B/year. Current GCMs don’t reliably simulate how that recurrence will change.
Where Does This Leave Us?
Reasonably good first-generation reduced-form agricultural damage functions exist - capturing temperature and CO₂ dimensions, accounting for some trade dynamics, and runnable across warming levels. The Fei et al. framework represents real progress, as does work by Moore et al. (2017), who systematically compared process-based and statistical yield models and connected both to economic welfare through a global trade model.
The by-degree approach - indexing damages to global temperature - works well for many sectors, but agriculture is a case where a temperature-only damage function has drawbacks if CO₂ is left implicit. Building proper two-dimensional response surfaces that treat temperature and CO₂ as independent inputs is feasible but requires deliberate effort. Pattern scaling sidesteps this particular problem by preserving CO₂ as an explicit input, but at the cost of computational complexity. Either way, the CO₂ fertilization assumption deserves to be made explicit rather than buried.
Beyond the CO₂/temperature dimensionality problem, two other processes stand out as underrepresented in current frameworks. The first is extreme flooding: GCMs systematically underestimate the frequency and intensity of the events that drive the largest crop losses, and even a modest increase in recurrence frequency translates into billions of dollars in annualized damages. The second is the pesticide and herbicide feedback: as warming expands pest ranges and accelerates weed growth, increased chemical use imposes real costs on farmers and downstream costs on water quality and ecosystems that current damage functions don’t capture. Getting these right won’t be easy but they are knowable problems, which is a reasonable place to start.
Marcus Sarofim is a Senior Research Scientist at NYU’s Marron Institute and a Lecturer at Johns Hopkins’s Energy Policy and Climate Program. He spent 17 years in EPA’s Climate Change Division. He writes The Saraph Report, where “Saraph” derives from the Hebrew root of his surname, meaning fire.
I have published 50+ papers. Three I’m particularly proud of all involve finding simpler ways to model complex climate phenomena: a by-degree impact method for the US, a paper on the probability of 2100 temperatures compared to the RCPs, and a paper on what timeframes should be used for global warming potentials. The GWP paper was recently cited in a Climate Brink post, which made me happy.
Captured by a photosynthetic pathway that takes advantage of a quirk of quantum mechanics described by Rudy Marcus and now called “Marcus Theory.” I have a soft spot for this theory for obvious reasons.
Because C4 and C3 pathways fix a different proportion of C13 to C12, it turns out you can tell how much of one’s diet ultimately came from corn (including livestock fed on corn, and high fructose corn syrup in soda) versus C3 crops by testing the isotope ratio in your skin.
For allergy sufferers: climate change is a lose-lose-lose situation. Longer growing seasons mean longer allergy seasons. Higher CO₂ means plants produce more pollen, and that pollen is more allergenic. Also, poison ivy grows faster and produces more urushiol. You’re welcome.
This is due to increases in US production, with an assumption of no production changes globally.
Whether we really need 30+ GCMs is a question for another post.
I focused on these in a paper in Nature Communications.
Rising and Devineni (2020) found that crop switching alone could reduce US agricultural losses from climate change by roughly half under RCP 8.5.
Marcus, I feel like you need to follow up this post with a discussion about methane; specifically, discussion (including criticisms) of the Inflation Reduction Act and MERP, marginal conventional wells, landfill and agriculture contributions to climate change, and methane gridding
“Carbon fertilization is, on net, mostly a good thing for plant growth. But it has three important drawbacks…”
Drawbacks?? On the other hand, urgent reductions in CO2 emissions will take none of the CO2 already added out of the atmosphere to lower global temperatures. And industrial carbon capture and long term geological storage can’t possibly take enough out to matter. CO2 fertilization will help agriculture to feed people. A net plus that essentially cancels those drawbacks.